Hydrochemistry is the study of chemical properties and processes that occur in water, including the interactions between water and the surrounding environment. To understanding the chemical composition of water and assess their suitability for drinking and irrigation purpose, water samples were collected of Mbankomo at 10 locations during rainy seasons. From theses samples, anions and cations were separated by high performance liquid chromatography (HPLC) using a Dionex ICS-1100 with 0.45 µm diameter. From de findings, it is clear that surface water has an average pH of 5.63 while, groundwater has an arithmetic mean pH of 5.94, with a range between 5.00 and 6.64. These data indicates that the water remains acidic. From the values of TDS (Total Dissolved Solid) (average value of 26.65 mg/l. in surface water; 27.30 to 118.38 mg/l, in groundwater) water samples in the study area are considered fresh (TDS < 1000 mg/l). Water in the research area acquires mineralization through a variety of natural geochemical processes, such as weathering, dissolution, ion exchange processes, and human activity. WQI (Water Quality Index), based on 14 major parameters indicate that water of study area are good to excellent and can use for drinking, irrigation and industry. The water of study area is suitable for irrigation for almost all types of crops with a possibility of limited sodium hazards.
| Published in | Hydrology (Volume 13, Issue 2) |
| DOI | 10.11648/j.hyd.20251302.16 |
| Page(s) | 153-173 |
| Creative Commons |
This is an Open Access article, distributed under the terms of the Creative Commons Attribution 4.0 International License (http://creativecommons.org/licenses/by/4.0/), which permits unrestricted use, distribution and reproduction in any medium or format, provided the original work is properly cited. |
| Copyright |
Copyright © The Author(s), 2025. Published by Science Publishing Group |
Hydrochemistry, Water Quality, Irrigation Management, Mbankomo, Cameroon
Rank | WQI | Water quality | Possible Use |
|---|---|---|---|
1 | 0 - 25 | Excellent | Potable water. irrigation and industry |
2 | 25 - 50 | Good | Potable water. irrigation and industry |
3 | 50 - 75 | Poor | Irrigation and industry |
4 | 75 - 100 | Very poor | Irrigation |
5 | > 100 | Non-drinkable water | Suitable treatment before use |
Water type | CODE | T (°C) | pH | EC (μS/cm) | MES (mg/l) | TDS (mg/l) | Na+ (mg/l) | K+ (mg/l) | Mg2+ (mg/l) |
|---|---|---|---|---|---|---|---|---|---|
Surface water | MBS1 | 23.60 | 6.37 | 46.30 | 1.55 | 31.85 | 0.85 | 0.67 | 0.44 |
MBS2 | 22.30 | 4.90 | 31.00 | 1.97 | 21.45 | 1.22 | 0.77 | 0.61 | |
Mean | 22.95 | 5.63 | 38.65 | 1.76 | 26.65 | 1.03 | 0.72 | 0.52 | |
Groundwater | MBSP | 24.70 | 6.64 | 45.70 | 2.03 | 118.38 | 0.73 | 0.53 | 0.27 |
MBW1 | 24.60 | 6.50 | 181.38 | 0.80 | 81.90 | 0.15 | 0.06 | 0.06 | |
MBW2 | 24.30 | 6.38 | 124.90 | 1.50 | 55.90 | 0.14 | 0.05 | 0.06 | |
MBW3 | 24.90 | 5.55 | 86.20 | 0.96 | 31.20 | 0.14 | 0.06 | 0.07 | |
MBW4 | 24.50 | 5.58 | 47.90 | 0.88 | 35.75 | 0.13 | 0.05 | 0.09 | |
MBW5 | 24.20 | 5.50 | 55.30 | 3.90 | 31.20 | 0.15 | 0.05 | 0.09 | |
MBW6 | 24.30 | 5.00 | 47.90 | 2.36 | 27.30 | 0.19 | 0.08 | 0.11 | |
MBW7 | 24.90 | 6.41 | 42.10 | 2.70 | 29.90 | 1.15 | 1.04 | 0.73 | |
Min | 24.20 | 5.00 | 42.10 | 0.80 | 27.30 | 0.13 | 0.05 | 0.06 | |
Max | 24.90 | 6.64 | 181.38 | 3.90 | 118.38 | 1.15 | 1.04 | 0.73 | |
Mean | 24.55 | 5.94 | 78.92 | 1.89 | 51.44 | 0.35 | 0.24 | 0.19 |
Water type | CODE | Ca2+ (mg/l) | NH4+ (mg/l) | Cl- (mg/l) | NO3- (mg/l) | SO42- (mg/l) | HCO3- (mg/l) | F- (mg/l) | PO43- (mg/l) |
|---|---|---|---|---|---|---|---|---|---|
Surface water | MBS1 | 3.67 | 0.05 | 9.64 | 26.52 | 18.50 | 0.99 | 0.20 | 0.08 |
MBS2 | 1.83 | 0.29 | 15.52 | 102.07 | 11.65 | 0.99 | 0.55 | 0.00 | |
Mean | 2.75 | 0.17 | 12.58 | 64.29 | 15.07 | 0.99 | 0.37 | 0.04 | |
Groundwater | MBSP | 3.09 | 0.07 | 11.45 | 55.29 | 18.93 | 0.36 | 0.41 | 0.03 |
MBW1 | 0.17 | 0.03 | 4.35 | 23.66 | 83.66 | 0.60 | 1.06 | 0.01 | |
MBW2 | 0.14 | 0.03 | 15.87 | 33.52 | 71.06 | 0.95 | 0.93 | 0.02 | |
MBW3 | 0.13 | 0.02 | 29.97 | 116.74 | 339.24 | 1.58 | 1.40 | 0.03 | |
MBW4 | 0.18 | 0.02 | 22.51 | 89.73 | 194.87 | 1.98 | 1.07 | 0.04 | |
MBW5 | 0.21 | 0.04 | 14.10 | 44.77 | 35.72 | 6.23 | 0.41 | 0.01 | |
MBW6 | 0.32 | 0.06 | 8.61 | 44.81 | 18.50 | 0.90 | 3.00 | 0.03 | |
MBW7 | 1.53 | 0.03 | 21.74 | 61.15 | 10.94 | 0.88 | 0.86 | 0.02 | |
Min | 0.13 | 0.02 | 4.35 | 23.66 | 10.94 | 0.36 | 0.30 | 0.01 | |
Max | 3.09 | 0.07 | 29.97 | 116.74 | 339.24 | 6.23 | 1.38 | 0.04 | |
Mean | 0.72 | 0.03 | 16.08 | 58.71 | 96.61 | 1.68 | 0.80 | 0.02 |
Parameter | Na+ | K+ | Mg2+ | Ca2+ | Cl- | NO3- | SO42- | HCO3- | NH4+ | F- | pH | T°C | CE | MES | TDS |
|---|---|---|---|---|---|---|---|---|---|---|---|---|---|---|---|
Na+ | 1.00 | ||||||||||||||
K+ | 0.98 | 1.00 | |||||||||||||
Mg2+ | 0.97 | 0.98 | 1.00 | ||||||||||||
Ca2+ | 0.74 | 0.73 | 0.63 | 1.00 | |||||||||||
Cl- | -0.01 | 0.03 | 0.07 | -0.26 | 1.00 | ||||||||||
NO3- | 0.14 | 0.08 | 0.14 | -0.16 | 0.80 | 1.00 | |||||||||
SO42- | -0.53 | -0.51 | -0.49 | -0.48 | 0.70 | 0.61 | 1.00 | ||||||||
HCO3- | -0.33 | -0.34 | -0.28 | -0.35 | 0.14 | 0.01 | 0.05 | 1.00 | |||||||
NH4+ | 0.24 | 0.22 | 0.11 | 0.66 | -0.56 | -0.37 | -0.54 | -0.10 | 1.00 | ||||||
F- | -0.38 | -0.33 | -0.30 | -0.60 | 0.62 | 0.46 | 0.80 | -0.13 | -0.81 | 1.00 | |||||
pH | 0.08 | 0.20 | 0.07 | 0.36 | -0.22 | -0.55 | -0.16 | -0.32 | 0.13 | 0.10 | 1.00 | ||||
T°C | -0.49 | -0.33 | -0.42 | -0.33 | 0.24 | -0.14 | 0.40 | 0.00 | -0.06 | 0.46 | 0.48 | 1.00 | |||
CE | -0.54 | -0.52 | -0.53 | -0.47 | -0.28 | -0.39 | 0.24 | -0.17 | -0.43 | 0.53 | 0.42 | 0.33 | 1.00 | ||
MES | 0.23 | 0.24 | 0.27 | 0.08 | -0.12 | -0.20 | -0.57 | 0.63 | 0.33 | -0.59 | -0.20 | -0.10 | -0.48 | 1.00 | |
TDS | -0.53 | -0.51 | -0.53 | -0.46 | -0.29 | -0.40 | 0.24 | -0.17 | -0.43 | 0.52 | 0.42 | 0.31 | 1.00 | -0.48 | 1.00 |
Samples | WQI | Water type | Possible use |
|---|---|---|---|
MBW1 | 38.00 | Good | Potable water. Irrigation and industry |
MBW2 | 34.07 | Good | Potable water. Irrigation and industry |
MBW3 | 47.52 | Good | Potable water. Irrigation and industry |
MBW4 | 39.15 | Good | Potable water. Irrigation and industry |
MBW5 | 21.36 | Excellent | Potable water. Irrigation and industry |
MBW6 | 18.90 | Excellent | Potable water. Irrigation and industry |
MBW7 | 33.89 | Good | Potable water. Irrigation and industry |
MBSP | 24.77 | Excellent | Potable water. Irrigation and industry |
MBS1 | 17.18 | Excellent | Potable water. Irrigation and industry |
MBS2 | 25.26 | Good | Potable water. Irrigation and industry |
Parameters | Range | Class | N° of sample | Percentage of sample |
|---|---|---|---|---|
Na% | ˂200 | Maximum allowable limit | MBW1. MBW2. MBW3. MBW4. MBW5. MBW6. MBW7. MBSP. MBS1. MBS2 | 100.0% |
>200 | Above allowable limit | |||
SAR (Sodium Adsorption Ratio) | ˂20 | Excellent | MBW1. MBW2. MBW3. MBW4. MBW5. MBW6. MBW7. MBSP. MBS1. MBS2 | 100.0% |
20-40 | Good | |||
40-60 | Permissible | |||
60-80 | Doubtful | |||
>80 | Unsuitable | |||
TDS (mg/l) | ˂ 450 | Excellent | MBW1. MBW2. MBW3. MBW4. MBW5. MBW6. MBW7. MBSP. MBS1. MBS2 | 100.0% |
450-2000 | Moderate | |||
KR | ˂ 1 | Safe | MBW1. MBW2. MBW3. MBW4. MBW5. MBW6. MBW7. MBSP. MBS1. MBS2 | 100.0% |
> 1 | Unsafe | |||
MAR (%) | ˂ 50 | Safe | MBW1. MBW2. MBW3. MBW4. MBW5. MBW6. MBW7. MBSP. MBS1. MBS2 | 100.0% |
> 50 | Unsafe | |||
PS (meq/L) | ˂ 5 | Excellent to good | MBW1. MBW2. MBW3. MBW4. MBW5. MBW6. MBW7. MBSP. MBS1. MBS2 | 100.0% |
5-10 | Good to injurious | |||
> 10 | Injurious to unsatisfactory | |||
RSC (meq/L) | ˂ 1.25 | Good | MBW1. MBW2. MBW3. MBW4. MBW5. MBW6. MBW7. MBSP. MBS1. MBS2 | 100.0% |
1.25-2.5 | Doubtful | |||
> 2.5 | Unsuitable | |||
CAI-1 | ˂ 0 | Class-I | MBW1. MBW2. MBW3. MBW4. MBW5. MBW6. MBW7. MBSP. MBS1. MBS2 | 100.0% |
> 0 | Class-II | |||
CAI-2 | ˂ 0 | Class-I | MBW1. MBW2. MBW3. MBW4. MBW5. MBW6. MBW7. MBSP. MBS1. MBS2 | 100.0% |
> 0 | Class-II |
TDS | Total Dissolved Solid |
WQI | Water Quality Index |
pH | Potential of Hydrogen |
EC | Electrical Conductivity |
EDTA | Ethylene Diamine Tetraacetic Acid |
HPLC | High Performance Liquid Chromatography |
SAR | Sodium Absorption Ratio |
KR | Kelly Ratio |
SSP | Soluble Sodium Percentage |
RSC | Residual Sodium Carbonate |
MAR | Magnesium Absorption Ratio |
PS | Potential Salinity |
WHO | World Health Organization |
CAI | Chloro-alkaline Index |
| [1] | Ofosu, S. A., Adjei, K. A., & Odai, S. N. Assessment of the quality of the Densu river using multicriterial analysis and water quality index. Applied Water Science. 2021, 11(12), 183. |
| [2] | Hosseininia, M., Hassanzadeh, R. Groundwater quality assessment for domestic and agricultural purposes using GIS, hydrochemical facies and water quality indices: case study of Rafsanjan plain, Kerman province, Iran. Applied Water Science. 2023, 13(3), 84. |
| [3] | Jalali, M., Shademani, M., Paripour, M., Jalali, M. Assessment of water quality for mountainous high-elevated spring waters using self-organized maps. Groundwater for Sustainable Development. 2024, vol. 24. |
| [4] | Varis, O. Resources: Curb vast water use in central Asia. Nature 514, 27-29. 2014. |
| [5] | Cantillana, R., Molina, J. L., Iniesta-Arandia, I. Bringing water values into play in the Atacama desert water crisis, Journal of Arid Environments. 2024, Volume 225, 105256, ISSN 0140-1963, |
| [6] | Zhang, Y., Chen, Z., Huang, G., Yang, M. Origins of groundwater nitrate in a typical alluvial-pluvial plain of North China plain: New insights from groundwater age-dating and isotopic fingerprinting. Environmental Pollution. 2023, 316, 120592. |
| [7] | Chen, K., Liu, Q., Yang, T., Ju, Q., Zhu, M. Risk assessment of nitrate groundwater contamination using GIS-based machine learning methods: A case study in the northern Anhui plain, China. Journal of Contaminant Hydrology. 2024, 261, 104300. |
| [8] | Rashid, I., Naqvi, S. N. H., Mohsin, H., Fatima, K., Afzal, M., Al-Misned, F., … Niazi, N. K. The evaluation of bacterial-augmented floating treatment wetlands for concomitant removal of phenol and chromium from contaminated water. International journal of phytoremediation. 2024. 26(2), 287-293. |
| [9] | Chen, K., Liu, Q., Peng, W., Liu, X. Source apportionment and natural background levels of major ions in shallow groundwater using multivariate statistical method: a case study in Huaibei Plain, China. J Environ Manag. 2022, 301: 113806. |
| [10] | Gao, J., Deng, G., Jiang, H., Wen, Y., Zhu, S., He, C., Cao, Y. Water quality pollution assessment and source apportionment of lake wetlands: A case study of Xianghai Lake in the Northeast China Plain. Journal of Environmental Management. 2023, 344, 118398. |
| [11] | Subba Rao, G., Harsha, G. S., Jeelani, S. H., Rizvi, S. S., Roy, S. K., Manjaly, M. S. Groundwater Quality Assessment for Drinking and Irrigational Purposes Using Water Quality Index (WQI) of Dubbak (M), Siddipet District, Telangana, India. In International Conference on Advances in Environmental Sustainability, Energy and Earth Science. 2024, (pp. 271-297). AESEE 2024. Springer, Cham. |
| [12] | Chaudhary, R., Gaur, N., Yadav, M. Hydrogeochemical analysis of groundwater quality during the pre-monsoon season of Manipur, India. Water Science. 2024, 38(1), 274-292. |
| [13] | Giridharan, L., Venugopal, T., Jayaprakash, M. Evaluation of the seasonal variation on the geochemical parameters and quality assessment of the groundwater in the proximity of River Cooum, Chennai, India. Environmental monitoring and assessment. 2008, 143, 161-178. |
| [14] | Aly, A. A. Hydrochemical characteristics of Egypt western desert oases groundwater. Arabian Journal of Geosciences. 2015, 8(9), 7551-7564. |
| [15] | Aghazadeh, N., Chitsazan, M., & Golestan, Y. Hydrochemistry and quality assessment of groundwater in the Ardabil area, Iran. Applied Water Science. 2017, 7, 3599-3616. |
| [16] | Jahanshahi, R., Mahmoodinejad, N., & Mali, S. Hydrogeochemistry and groundwater origin in the Sarduiyeh area, Iran. Geopersia, 2025. |
| [17] | Nzenti, J. P., Barbey, P. Macaudier, E. J., Soba, D. Origin and evolution of the late Precambrian high grade Yaoundé gneiss (Cameroon). Precambian Research. 1988, 38, pp 91 - 109. |
| [18] | Nzenti, J. P. Neoproterozoic alkaline meta-igneous rocks from the Pan-African North Equatorial Fold Bel (Yaounde, Cameroon): biotitites and magnetite rich pyroxenites. Journal of African Earth Sciences. 1998. 26(1), 37-47. |
| [19] | Toteu, S. F., Penaye, J., Djomani, P. Y. Evolution géodynamique de la ceinture panafricaine en Afrique centrale avec une référence particulière au Cameroun. Revue canadienne des sciences de la Terre. 2004, 41(1): 73-85. |
| [20] | Metang, V., Nomo Negue, E., Ganno, S., Takodjou Wambo, J. D., Ewolo Teme, A. M., Teda Soh, A. C., Fossi, D. H., Nkanga Mbakam, M. D., Tchameni, R., Nzenti, J. P. Anatexis of metadiorite from the Yaounde area, central african oregenic b elt in Cameroon: implications on the genesis of in-source granodiorite leucosomes. Arabian Journal of Geosciences. 2022, 15(4), 359. |
| [21] | Mvondo, H. Analyses structurale et pétro géochimique des roches de la région de Yaoundé Nord: Arguments contribuant à la connaissance de l’évolution géotechnique de la chaine panafricaine au Cameroun. Thèse Doct. Univ. Ydé I. 2003, 173 p. |
| [22] | Djeuda Tchapnga, H. B., Tanawa, E., Ngnigam, E. L’eau au Cameroun: Approvisionnement en Eau Potable (Tome 1). Presses Universitaires Yaoundé. 2001, 359 p. |
| [23] | Djeuda Tchapnga, H. B. Géologie et hydrogéologie d’un secteur de la zone mobile d’Afrique centrale: région de poli, nord - Cameroun. Thèse doct. Univ. sci. tech. et méd. de Grenoble 1, France. 1987, 333 p. |
| [24] | Wyns, R. Ressources en eau de la Margeride ouest - PRD 324 - Modélisation de la géométrie (altitude, épaisseur) des arènes granitiques du bassin-versant lozérien de la Truyère (Lozère, Massif Central). Rapport BRGM R. 1998, 40191, 18 p. |
| [25] | Taylor, R., Howard, K. A tectono-geomorphic model pf the hydrogeology of deeply weathered crystalline rock: Evidence of Uganda. Hydrogeologie journal. 2000, (8): 279-294. |
| [26] | Maréchal, J. C., Wyns, R., Lachassagne, P., Subrahmanyam, K., Touchard, F. Vertical anisotropy of hydraulic conductivity in fissured layer of hard-rock aquifers due to the geological structure of weathering profiles. Comptes Rendus. Géoscience. 2003, 335(5), 451-460. |
| [27] | Lachassagne, P., Wyns, R. Aquifères de socle: nouveaux concepts. Application à la prospection et la gestion de la ressource en eau. Géosciences. 2005, (2), 32-37. |
| [28] | Ryan, A., Yeow, A., Swain, L. G., Webber, T. N. Water sampling procedures, safety and quality assurance. Environment Canada, BC Ministry of Environment. 2005. |
| [29] | Lienou, G. Impacts de la variabilité climatiques sur les ressources en eaux et les transports de matières en suspension de quelques bassins représentatifs au Cameroun. Thèse doctorat/Ph. D, Université de Yaoundé I. 2007, 405 p. |
| [30] | Kpoumié, A. Hydroclimatologie et transports solides dans un écosystème tropical anthropisé d’Afrique centrale dans un contexte déficitaire: cas du bassin versant de la Sanaga au Cameroun. Thèse doctorat/Ph. D, Université de Yaoundé I. 2015, 241 p. |
| [31] | Ndam Ngoupayou, J. R., Dzana, J. G., Kpoumie, A., Ghogomu, R. T., Fouepe Takounjou, A., Braun, J. J., Ekodeck, G. E. Present-day sediment dynamics of the Sanaga catchment (Cameroon): from the total suspended sediment (TSS) to erosion balance. Hydrological Sciences Journal. 2016, 61(6), 1080-1093. |
| [32] | Rakotondrabe, F., Ngoupayou, J. R. N., Mfonka, Z., Rasolomanana, E. H., Abolo, A. J. N., & Ako, A. A. (2017). Water quality assessment in the Bétaré-Oya gold mining area (East-Cameroon): multivariate statistical analysis approach. Science of the total environment, 610, 831-844. |
| [33] | Apha, A., 2012. Standard methods for the examination of water and wastewater, 22nd edition edited by E. W. Rice, R. B. Baird, A. D. Eaton and L. S. Clesceri. American Public Health Association (APHA), American Water Works Association (AWWA) and Water Environment Federation (WEF), Washington, D. C., USA. |
| [34] | Bon, A. F., Aoudou, D. S., Banakeng, A. L., Narke, C., Chouto, S., Ndam Mbouombouo, A., 2020. Contribution of a geostatistical model of electrical conductivity in the assessment of the water pollution index of the Quaternary aquifer of the Lake Chad basin (KousseriCameroon) Arab. J. Geosci. 13(4), 170. |
| [35] | Ngo Billong, P. T., Feumba, R., Ndjigui, P. D., 2023. Hydrogeochemical appraisal of groundwater quality in Ngoua watershed (Douala-Cameroon): Implication for domestic purposes. Scientific African 22(2023) e01910. |
| [36] | Mfonka, Z., Morbe Mbadngonel, C., Nsangou, D., Kpoumié, A., Kouassy Kalédjé P. S., Zammouri, M., ·Jules Ngoupayou, J. R., 2024. Groundwater quality assessment for drinking and agricultural purposes under arid climate in N’Djamena, Chad (Central Africa). Inter. J. of Energy and Water Resources |
| [37] | Gevorgyan, G., Khachatryan, G., Varagyan, A., Varagyan, V., Vaseashta, A. Hydrochemical Characterization, Source Identification, and Irrigation Water Quality Assessment in the Voghji River Catchment Area, Southern Armenia. Water. 2025, 17, 854. |
| [38] | Schoeller, H. Sur la concentration des sels dissous dans les eaux souterraines. The concentration of dissolved salts in groundwater. Rabat, Morocco In French. Comité Etudes eaux souterraines, Rabat Maroc. 1934, pp 46-54. |
| [39] | Laxman, K. D., Dhakate, R., Guguloth, S., Srinivas, B. Hydrochemical appraisal of groundwater quality for drinking and agricultural utility in a granitic terrain of Maheshwaram area of Ranga Reddy district (India). Hydroresearch. 2021, 4, 11-21. |
| [40] | Kumar, P., Vishwakarma, C. A., Singh, P., Rena, H. A. V., Mate, C. C., Mukherjee, S. Hydrogeochemical characterization and water quality evaluation for drinking and irrigation purposes of coastal aquifers of Middle Andaman. Discover Applied Sciences. 2024, 6(5), 228. |
| [41] | Bello, M., Ketchemen, T. B., Nlend, B., Huneau, F., Fouepe, A., Fantong, W. Y., Ngo Boum-Nkot, S., Garel, E., Celle-Jeanton, H. Shallow groundwater quality evolution after 20 years of exploitation in the southern Lake Chad: hydrochemistry and stable isotopes surveyin the far north of Cameroon. Environ. Earth Sci. 2019, 78, 1-19 |
| [42] | Haman, D. J. B., Fantong, Y. W., Ewodo Mboudou, G., Ombolo, A., Nenkam Jokam, T. L. L., Chounna, G. Y., Messi, G. Hydrogeochemistry and stable isotopes of groundwater in the Sudano-Sahelian zone: A case of the Mayo Bocki watershed in North Cameroon. HydroResearch. 2023, 36-51. |
| [43] | Venkatesan, S., Arumugam, S., Bagyaraj, M., Preethi, T., & Parthasarathy, P. Spatial assessment of Groundwater Quantity and Quality: A case study in parts of Chidambaram Taluk, Cuddalore District, Tamil Nadu. India. Sustainable Water Resource Management. 2021, 7, 103. |
| [44] | Al Haj, R., Merheb, M., Halwani, J., Ouddane, B. Hydrogeochemical characteristics of groundwater in the Mediterranean region: A meta-analysis. Physics and Chemistry of the Earth. 2022, 129, 103351. |
| [45] | Rahman, M. S., Selim Reza, A. H. M., Ahsan, M. A., Bakar Siddique, M. A. Arsenic in groundwater from Southwest Bangladesh: Sources, water quality, and potential health concern. HydroResearch. 2023, 6, 1-15. |
| [46] | Bouteraa, O., Mebarki, A., Bouaicha, F., Nouaceur, Z., & Laignel, B. Groundwater quality assessment using multivariate analysis, geostatistical modeling, and water quality index (WQI): a case of study in the Boumerzoug-El Khroub valley of Northeast Algeria. Acta Geochimica. 2019. 38, 796-814. |
| [47] | Jena, P. K., Rahaman, S. M., Das Mohapatra, P. K., Barik, D. P., & Patra, D. S.. Surface water quality assessment by Random Forest. Water Practice & Technology. 2023, 18(1), 201-214. |
| [48] | Talhaoui A, El Hmaidi A, Jaddi H, Habiba Ousmana H, Manssouri I. Calculation of the Water Quality Index (WQI) for the Evaluation of the Physico-Chemical Quality of Surface Waters of the MoulouyaWadi (NE, Morocco). European Scientific Journal January 2020 edition Vol.16, No.2 ISSN: 1857 - 7881 (Print) e - ISSN 1857- 7431. |
| [49] | Kadam A, Wagh V, Jacobs J, Patil S, Pawar N, Umrikar B, Sankhua R., Kumar S. Integrated approach for the evaluation of groundwater quality through hydro geochemistry and human health risk from Shivganga river basin, Pune, Maharashtra, India. Environ. Sci. Pollut. Res., 2021, 1 -23. |
| [50] | Ngo Boum-Nkot S, Nlend B, Komba D, Nkoue Ndondo GR, Bello M, Fongoh EJ, Ntamak-Nida MJ, Etame J. Hydrochemistry and assessment of heavy metals groundwater contamination in an industrialized city of sub-Saharan Africa (Douala, Cameroon). Implication on human health HydroResearch 6(2023) 52-64. |
| [51] | Pimparkar AM, Patil SN, Patil BD, Kadam AK. Comparative assessment of wetland water quality from rural and urban area of Aurangabad District, Maharashtra, India using water quality index HydroResearch 6(2023) 269-278. |
| [52] | Goher, M. E., Hassan, A. M., Abdel-Moniem, I. A., Fahmy, A. H., & El-Sayed, S. M. Evaluation of surface water quality and heavy metal indices of Ismailia Canal, Nile River, Egypt. Egyptian Journal of Aquatic Research. 2014, 40(3), 225-233. |
| [53] | WHO. Directives de qualité pour l’eau de boisson: 4e éd. Intégrant le premier additif. 2017, 539 p. |
| [54] | Balamurugan P, Kumar PS, Shankar K, Dataset on the suitability of groundwater for drinking and irrigation purposes in the Sarabanga River region, Tamil Nadu, India. Data Br. 2020, 29, 105255. |
| [55] | Kawo NS, Karuppannan S. Groundwater quality assessment using water quality index and GIS technique in Modjo River basin, Central Ethiopia. J. Afr. Earth Sci., 2018, 147, 300- 311. |
| [56] | Gao Z, Han C, Xu Y, Zhao Z, Luo Z, Liu J,. Assessment of the water quality of groundwater in Bohai rim and the controlling factors a case study of northern Shandong peninsula, North China. Environ. Pollut. 2021, 85, 117482. |
| [57] | Pacheco FAL, Van der Weijden CH. Contributions of water-rock interactions to the composition of groundwaters in areas with a sizeable anthropogenic input: a case study of thewater of the Fundao area, central Portugal. Water Resour Res, 1996, 32(12): 3553-3570. |
| [58] | Pacheco FAL. Application of correspondence analysis in the assessment of groundwater chemistry. Math Geol., 1998, 30(2): 129-161. |
| [59] | Todd, D. K. In: Jon, N. Y. (Ed.), Groundwater Hydrology. Wiley Sons Inc. 1980, 535 p. |
| [60] | Kelley, W. P. (1963). Use of saline irrigation water. Soil science, 95(6), 385-391. |
| [61] | Ghalib, H. B. Groundwater chemistry evaluation for drinking and irrigation utilities in east Wasit province, Central Iraq. Applied Water Science. 2017, 7, 3447-3467. |
| [62] | Eaton, F. M. Significance of carbonates in irrigation waters. Soil science. 1950, 69(2), 123-134. |
| [63] | Raghunath, H. M. Ground water: hydrogeology, ground water survey and pumping tests, rural water supply and irrigation systems. New Age International. 1987, 549 p. |
| [64] | Szabolcs, I.; Darab, C. The Influences of Irrigation Water of High Sodium Carbonate Contents on Soils. In Proceedings of the 8th International Congress Soil Science Sodic Soils, Bucharest, Romania, 31 August-9 September 1964; pp. 802-812. |
| [65] | WHO. Guidelines for Drinking-Water Quality. Recommandations. 4th edition. World Health Organization, Geneva. 2011. |
| [66] | Zebaze Togouet, S. H., Boutin, C., Njiné, T., Kemka, N., Nola, M., Menbohan, S. F. First data on the groundwater quality and aquatic fauna of some wells and springs from Yaounde (Cameroon). European journal of water quality. 2009, 40(1), 51-74. |
| [67] | Zébazé Togouet, S. H., Tuekam Kayo, R. P., Boutin, C., Nola, M., & Foto Menbohan, S. Impact de la pression anthropique sur l’eau et la faune aquatique des puits et sources de la région de Yaoundé (Cameroun, Afrique Centrale). Bulletin de la société d’Histoire Naturelle de Toulouse. 2011, 147, 27-41. |
| [68] | Wirmvem, M. J., Ohba, T., Fantong, W. Y., Ayonghe, S. N., Suila, J. Y., Asaah, A. N. E.,... Hell, J. V. Hydrochemistry of shallow groundwater and surface water in the Ndop plain, North West Cameroon. African Journal of Environmental Science and Technology. 2013, 7(6), 518-530. |
| [69] | Tuekam, R. P., Nyamsi Tchactcho, N. L., Noah Ewoti, V., Chinche, SB., Nziéleu, J. G., Poutougnigni, O. F., Zébazé S. H. Physicochemical characterization dynamics abondance bactériological and aquatic faune of groundwater in the city of Mbalmayo (Cameroon). Journal of biodiversity and environment science. 2021, 13(2), 1 -15. |
| [70] | Tamonkem, R. A., Tchouta, K. D., Mvondo V. Y. E., Iwoudam M. E., Ngounou Ngatcha B. Contribution of Piezometry and Hydro-Geochemistry to a Better Understanding of the Adamawa-Yadé Hard Rock Aquifer System in Ngaoundéré. American Journal of Water Resources. 2024. 12(2), 39-52. |
| [71] | Takang, A. V., Wotany, E. R., Agyinyi C. Evaluation of surface water quality for domestic and agro-industrial applications along the tropical rainforest gradient, central Cameroon. 2025, 19(3), 89-105, |
| [72] | Yongue-Fouateu, R. Contribution à l’étude pétrographique de l’altération et des faciès de cuirassement ferrugineux des gneiss migmatitiques de la région de Yaoundé. Univ. Yaoundé. 1986. 214 p. |
| [73] | Ndam Ngoupayou, J. R. Bilans hydrochimiques sous forêt tropical humide en Afrique: exemple du bassin expérimental de Nsimi-Zoétélé au réseau hydrographique du Nyong et de la Sanaga (Sud Cameroun). Thèse Univ. de Paris IV. 1997, 214 p. |
| [74] | Mfonka, Z., Kpoumie, A. C., Ngouh, A. N., Ndam Ngoupayou, J. R. Groundwater quality assessment under the arid climate zone in the Central Africa: case study of the South-west of N’Djamena. Journal of Water Resource and Protection. 2020, 13(2), 112-138. |
| [75] | Bon, A. F., Ngoss, T. A. M. N., Mboudou, G. E., Banakeng, L. A., Ngoupayou, J. R. N., & Ekodeck, G. E. Groundwater flow patterns, hydrogeochemistry and metals background levels of shallow hard rock aquifer in a humid tropical urban area in sub-Saharan Africa-A case study from Olézoa watershed (Yaoundé-Cameroon). Journal of Hydrology: Regional Studies. 2021, 37, 100904. |
| [76] | Dash, S., Kalamdhad, A. S. Hydrochemical dynamics of water quality for irrigation use and introducing a new water quality index incorporating multivariate statistics. Environmental Earth Sciences. 2021, 80(3), 73. |
| [77] | Freeze RA, Cherry JA, Groundwater. Englewood, New Jersey: Prentice-Hall Inc., 1979. |
| [78] | Takounjou, A. F., Ndam Ngoupayou, J. R., Riotte, J., Takem, G. E., Mafany, G., Marechal, J. C., Ekodeck, G. E. Estimation of groundwater recharge of shallow aquifer on humid environment in Yaounde, Cameroon using hybrid water-fluctuation and hydrochemistry methods. Environ. Earth Sci. 2011, 64(1): 107-118. |
| [79] | Edmunds, W. M., Smedley, P. L. Groundwater geochemistry and health: an overview. Geological Society, London, Special Publications. 1996, 113(1), 91-105. |
| [80] | Piper, A. M. A graphic procedure in the geochemical interpretation of water‐analyses. Eos, Transactions American Geophysical Union. 1944, 25(6), 914-928. |
| [81] | Gibbs, R. J. Mechanisms controlling world water chemistry. Science. 1970, 170(3962), 1088-1090. |
| [82] | Marandi, A., Shand, P. Groundwater chemistry and the Gibbs Diagram. Applied Geochemistry. 2018, 97, 209-212. |
| [83] | Bon, A. F., Abderamane, H., Ewodo Mboudou, G., Aoudou Doua, S., Banakeng, L. A., Bontsong Boyomo, S. B., & Wangbara Damo, B.. Parametrization of groundwater quality of the Quaternary aquifer in N’Djamena (Chad), Lake Chad Basin: Application of numerical and multivariate analyses. Environmental Science and Pollution Research. 2020b, 28, 12300-12320. |
| [84] | Menti, A. N., Wotany, E. R., Christopher, A., Wirmvem, M. J., & Ngai, N. J. Hydrogeochemical characterization of ground and surface water in the eastern part of the Adamawa-Yade domain, Bertoua-Cameroon. Discover Water. 2023. 3(1), 10. |
| [85] | Cendon, D. I., Larsen, J. R., Jones, B. G., Nanson, G. C., Rickleman, D., Hankin, S. I., Pueyo, J. J., Maroulis, J. Freshwater recharge into a shallow saline groundwater system, Cooper Creek floodplain, Queensland, Australia. J. Hydrol. 2010, 392(2-4): 150-163. |
| [86] | Tay, C. K. Hydrochemistry of groundwater in the Savelugu-Nanton District, Northern Ghana. Environ. Earth Sci. 2012, 67: 2077-2087. |
| [87] | Demlie M, Wohnlich S, Wisotzky F, Gizaw B. Groundwater recharge, flow and hydrogeochemical evolution in a complex volcanic aquifer system, central Ethiopia. Hydrogeol. J. 2007, 15: 1169-1181. |
| [88] | Fantong WY, Satake H, Ayonghe SN, Aka FT, Asai K. Hydrogeochemical controls and usability of groundwater in semi-arid Mayo Tsanaga River Basin, Far-North Cameroon. Environ. Geol. 2009, 58(6): 1281-1293. |
| [89] | Prasanna, M. V., Nagarajan, R., Chidambaram, S., Anand Kumar, A., & Thivya, C. Evaluation of hydrogeochemical characteristics and the impact of weathering in seepage water collected within the sedimentary formation. Acta Geochimica. 2017, 36, 44-51. |
| [90] | Yang, Q., Li, Z., Ma, H., Wang, L., Martín, J. D. Identification of the hydrogeochemical processes and assessment of groundwater quality using classic integrated geochemical methods in the Southeastern part of Ordos basin, China. Environmental Pollution. 2016, 218, 879-888. |
| [91] | Gopinath, S., Srinivasamoorthy, K., Saravanan, K., Prakash, R. Tracing groundwater salinization using geochemical and isotopic signature in Southeastern coastal Tamilnadu, India. Chemosphere. 2019, 236, 124305. |
| [92] | Liu, J., Peng, Y., Li, C., Gao, Z., & Chen, S. An investigation into the hydrochemistry, quality and risk to human health of groundwater in the central region of Shandong Province, North China. Journal of cleaner production. 2021, 282, 125416. |
| [93] | Gopal Krishan, Kumar M., Rao, M. S., Garg, R., Yadav, B. K., Kansal, M. L., Singh, S., Bradley, A., Muste, M., Sharma L. M. Integrated approach for the investigation of groundwater quality through hydrochemistry and water quality index (WQI). Urban Climate 47. 2023, 101383, |
| [94] | Okiongbo, K. S., Akpofure, E. Identification of hydrogeochemical processes in groundwater using major ion chemistry: a case study of Yenagoa and environs, southern Nigeria. Global Journal of Geological Sciences. 2014, 12, 39-52. |
| [95] | Gao, Z., Liu, J., Feng, J., Wang, M., Wu, G. Hydrogeochemical characteristics and the suitability of groundwater in the alluvial-diluvial plain of southwest Shandong Province, China. Water, 2019, 11(8), 1577. |
| [96] | Sahu, S., Gogoi, U., & Nayak, N. C. Groundwater solute chemistry, hydrogeochemical processes and fluoride contamination in phreatic aquifer of Odisha, India. Geoscience Frontiers. 2021, 12(3), 101093. |
| [97] | Abdelshafy, M., Saber, M., Abdelhaleem, A., Abdelrazek, S. M., & Seleem, E. M. Hydrogeochemical processes and evaluation of groundwater aquifer at Sohag city, Egypt. Scientific African. 2019, 6, e00196. |
| [98] | Sheikhy Narany, T., Ramli, M. F., Aris, A. Z., Sulaiman, W. N. A., Juahir, H., & Fakharian, K. Identification of the Hydrogeochemical Processes in Groundwater Using Classic Integrated Geochemical Methods and Geostatistical Techniques, in Amol Babol Plain, Iran. The Scientific World Journal. 2014(1), 419058. |
| [99] | Kanagaraj, G., Elango, L., Sridhar, S. G. D., & Gowrisankar, G. Hydrogeochemical processes and influence of seawater intrusion in coastal aquifers south of Chennai, Tamil Nadu, India. Environmental Science and Pollution Research. 2018, 25, 8989-9011. |
| [100] | Li, P., Wu, J., Qian, H. Hydrogeochemistry and Quality Assessment of Shallow Groundwater in the Southern Part of the Yellow River Alluvial Plain (Zhongwei Section), Northwest China. Earth Sci. Res. J. 2014, 18, 27-38. |
| [101] | Sajil Kumar, P. J., & James, E. J. Identification of hydrogeochemical processes in the Coimbatore district, Tamil Nadu, India. Hydrological Sciences Journal. 2016, 61(4), 719-731. |
| [102] | Liu, F., Wang, S., Yeh, T. C. J., Zhen, P., Wang, L., & Shi, L. Using multivariate statistical techniques and geochemical modelling to identify factors controlling the evolution of groundwater chemistry in a typical transitional area between Taihang Mountains and North China Plain. Hydrological Processes. 2020, 34(8), 1888-1905. |
| [103] | Li, P., Wu, J., Qian, H. et al. Hydrogeochemical Characterization of Groundwater in and Around a Wastewater Irrigated Forest in the Southeastern Edge of the Tengger Desert, Northwest China. Expo Health. 2016, 8, 331-348. |
| [104] | Juen, L. L., Aris, A. Z., Shan, N. T., Yusoff, F. M., Hashim, Z. Geochemical modeling of element species in selected tropical estuaries and coastal water of the Strait of Malacca. Procedia Environmental Sciences. 2015, 30, 109-114. |
| [105] | Huneau, F., Dakoure, D., Celle-Jeanton, H., Vitvar, T., Ito, M., Traore, S., Le Coustumer, P. Flow pattern and residence time of groundwater within the south-eastern Taoudeni sedimentary basin (Burkina Faso, Mali). Journal of Hydrology. 2011, 409(1-2), 423-439. |
| [106] | Othman, F., Farrag, A., Seleem, E. M. M., & Salman, S. A. Groundwater Quality Evaluation Using Hydrogeochemical and GIS Techniques in the Southwest Part of Sohag, Egypt. The Iraqi Geological Journal. 2022, 93-104. |
| [107] | Gaikwad, S. K., Kadam, A. K., Ramgir, R. R., Kashikar, A. S., Wagh, V. M., Kandekar, A. M., & Kamble, K. D. Assessment of the groundwater geochemistry from a part of west coast of India using statistical methods and water quality index. Hydro Research. 2020, 3, 48-60. |
| [108] | Siban, M. & Zewd, I. The effects of alkalinity on physical and chemical properties of soil, Journal of Plant Biology and Agricultural Sciences. 2021, 3, 1-5. |
| [109] |
Davis, J. G., Waskom, R. M. & Bauder, T. A. Managing Sodic Soils [Fact Sheet No. 0.504]. Mesa, CO: Colorado State University Extension. 2003, Available at:
https://extension.colostate.edu/topic-areas/agriculture/managing-sodic-soils-0-504/ |
| [110] |
Garcia, R. New Mexico Integrated Cropping Systems and Water Management Handbook [AGRO-76]. Washington, DC: U.S. Department of Agriculture Natural Resources Conservation Service. 2014, Available at:
https://www.nrcs.usda.gov/wps/portal/nrcs/detail/nm/technical/?cid¼nrcs144p2_068965 |
| [111] | Zhou, H., Shi, H., Yang, Y., Feng, X., Chen, X., Xiao, F. & Guo, Y. Insights into plant salt stress signalling and tolerance, Journal of Genetics and Genomics. 2024, 51(1), 16-34. |
| [112] | Abadi, H. T., Alemayehu, T., & Berhe, B. A. Assessing the suitability of water for irrigation purposes using irrigation water quality indices in the Irob catchment, Tigray, Northern Ethiopia. Water Quality Research Journal. 2025, 60(1), 177-195. |
| [113] | Wilcox, L. V., 1955. Classification and use of irrigation waters, USDA, circular 969. DC, USA: Washington. |
| [114] | Selvakumar, S., Chandrasekar, N., Kumar, G. Hydrogeochemical characteristics and groundwater contamination in the rapid urban development areas of Coimbatore, India. Water Resources and Industry. 2017, 17, 26-33. |
| [115] | Chitsazan, M., Aghazadeh, N., Mirzaee, Y., Golestan, Y., Mosavi, S. Hydrochemical characteristics and quality assessment of urban groundwater in Urmia City, NW Iran. Water Science and Technology: Water Supply. 2017, 17(5), 1410-1425. |
| [116] | Richards, L. A. Diagnosis and Improvement of Saline and Alkali Soils, U. S. Department of Agriculture Handbook. 1954, Vol. 60, Washington D. C., USA. 160 p. |
| [117] | Ravikumar, P., Somashekar, R. K., Angami, M. Hydrochemistry and evaluation of groundwater suitability for irrigation and drinking purposes in the Markandeya River basin, Belgaum District, Karnataka State, India. Environmental monitoring and assessment. 2011, 173(1), 459-487. |
| [118] | Hussain, Y., Ullah, S. F., Hussain, M. B. et al. Modelling the vulnerability of groundwater to contamination in an unconfined alluvial aquifer in Pakistan. Environ Earth Sci. 2017, 76, 84 |
| [119] | Neina, D. The role of soil pH in plant nutrition and soil remediation. Applied and environmental soil science. 2019, (1), 5794869. |
| [120] | Doneen, L. D. Water Quality for Irrigated Agriculture. In: Poljakoff-Mayber, A., Gale, J. (eds) Plants in Saline Environments. Ecological Studies. 1975, vol 15. Springer, Berlin, Heidelberg. |
| [121] | Brown RM, McClelland NI, Deininger RA, O’Connor MF. A water quality index—crashing the psychological barrier. In Indicators of Environmental Quality: Proceedings of a symposium held during the AAAS meeting in Philadelphia, Pennsylvania, 1972, pp173-182. Springer US. |
| [122] | Chatterjee C, Raziuddin M. Determinationof water quality index (WQI) of a degraded riverin Asansol industrial area (West Bengal) Ecology of polluted water, 2002, Vol. II. Arvind Kumar publishedby Kul Bushan Nangia. pp. 885-897. |
| [123] | Aher DN, Kele VD, Malwade KD, Shelke MD. Lake water quality indexing to identify suitable sites for household utility: a case study Jambhulwadi Lake; Pune (MS). International Journal of Engineering Research and Applications, 2016, 6(5), 16-21. |
APA Style
Onana, A. B. A., Kengmo, D. K., Onana, A. A. N., Ngoupayou, J. R. N. (2025). Hydrochemistry and Water Quality Index for Sustainable Drinking Water and Irrigation Management of Mbankomo (Center, Cameroon). Hydrology, 13(2), 153-173. https://doi.org/10.11648/j.hyd.20251302.16
ACS Style
Onana, A. B. A.; Kengmo, D. K.; Onana, A. A. N.; Ngoupayou, J. R. N. Hydrochemistry and Water Quality Index for Sustainable Drinking Water and Irrigation Management of Mbankomo (Center, Cameroon). Hydrology. 2025, 13(2), 153-173. doi: 10.11648/j.hyd.20251302.16
@article{10.11648/j.hyd.20251302.16,
  author = {Achille Basile Anaba Onana and Derrick Kengni Kengmo and Alix Audrey Nga Onana and Jules Remy Ndam Ngoupayou},
  title = {Hydrochemistry and Water Quality Index for Sustainable Drinking Water and Irrigation Management of Mbankomo (Center, Cameroon)
},
  journal = {Hydrology},
  volume = {13},
  number = {2},
  pages = {153-173},
  doi = {10.11648/j.hyd.20251302.16},
  url = {https://doi.org/10.11648/j.hyd.20251302.16},
  eprint = {https://article.sciencepublishinggroup.com/pdf/10.11648.j.hyd.20251302.16},
  abstract = {Hydrochemistry is the study of chemical properties and processes that occur in water, including the interactions between water and the surrounding environment. To understanding the chemical composition of water and assess their suitability for drinking and irrigation purpose, water samples were collected of Mbankomo at 10 locations during rainy seasons. From theses samples, anions and cations were separated by high performance liquid chromatography (HPLC) using a Dionex ICS-1100 with 0.45 µm diameter. From de findings, it is clear that surface water has an average pH of 5.63 while, groundwater has an arithmetic mean pH of 5.94, with a range between 5.00 and 6.64. These data indicates that the water remains acidic. From the values of TDS (Total Dissolved Solid) (average value of 26.65 mg/l. in surface water; 27.30 to 118.38 mg/l, in groundwater) water samples in the study area are considered fresh (TDS < 1000 mg/l). Water in the research area acquires mineralization through a variety of natural geochemical processes, such as weathering, dissolution, ion exchange processes, and human activity. WQI (Water Quality Index), based on 14 major parameters indicate that water of study area are good to excellent and can use for drinking, irrigation and industry. The water of study area is suitable for irrigation for almost all types of crops with a possibility of limited sodium hazards.
},
 year = {2025}
}
TY  - JOUR
T1  - Hydrochemistry and Water Quality Index for Sustainable Drinking Water and Irrigation Management of Mbankomo (Center, Cameroon)

AU  - Achille Basile Anaba Onana
AU  - Derrick Kengni Kengmo
AU  - Alix Audrey Nga Onana
AU  - Jules Remy Ndam Ngoupayou
Y1  - 2025/06/30
PY  - 2025
N1  - https://doi.org/10.11648/j.hyd.20251302.16
DO  - 10.11648/j.hyd.20251302.16
T2  - Hydrology
JF  - Hydrology
JO  - Hydrology
SP  - 153
EP  - 173
PB  - Science Publishing Group
SN  - 2330-7617
UR  - https://doi.org/10.11648/j.hyd.20251302.16
AB  - Hydrochemistry is the study of chemical properties and processes that occur in water, including the interactions between water and the surrounding environment. To understanding the chemical composition of water and assess their suitability for drinking and irrigation purpose, water samples were collected of Mbankomo at 10 locations during rainy seasons. From theses samples, anions and cations were separated by high performance liquid chromatography (HPLC) using a Dionex ICS-1100 with 0.45 µm diameter. From de findings, it is clear that surface water has an average pH of 5.63 while, groundwater has an arithmetic mean pH of 5.94, with a range between 5.00 and 6.64. These data indicates that the water remains acidic. From the values of TDS (Total Dissolved Solid) (average value of 26.65 mg/l. in surface water; 27.30 to 118.38 mg/l, in groundwater) water samples in the study area are considered fresh (TDS < 1000 mg/l). Water in the research area acquires mineralization through a variety of natural geochemical processes, such as weathering, dissolution, ion exchange processes, and human activity. WQI (Water Quality Index), based on 14 major parameters indicate that water of study area are good to excellent and can use for drinking, irrigation and industry. The water of study area is suitable for irrigation for almost all types of crops with a possibility of limited sodium hazards.

VL  - 13
IS  - 2
ER  -
Geosciences of Superficial Formations and Applications Laboratory, Department of Earth Sciences, Faculty of Science, University of Yaounde I, Yaounde, Cameroon
Geosciences of Superficial Formations and Applications Laboratory, Department of Earth Sciences, Faculty of Science, University of Yaounde I, Yaounde, Cameroon
Geosciences of Superficial Formations and Applications Laboratory, Department of Earth Sciences, Faculty of Science, University of Yaounde I, Yaounde, Cameroon
Geosciences of Superficial Formations and Applications Laboratory, Department of Earth Sciences, Faculty of Science, University of Yaounde I, Yaounde, Cameroon
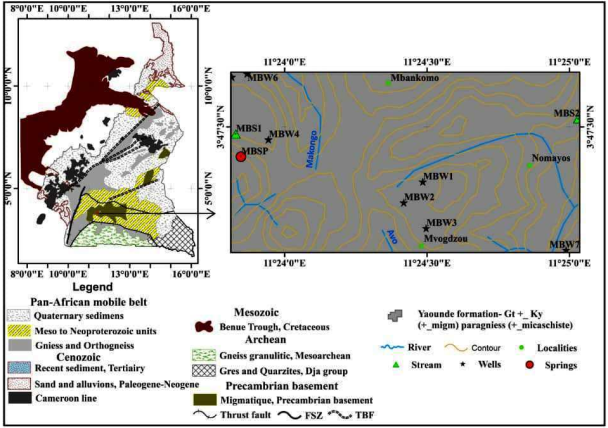
Figure 1. Geologic map of the study area with water sample.
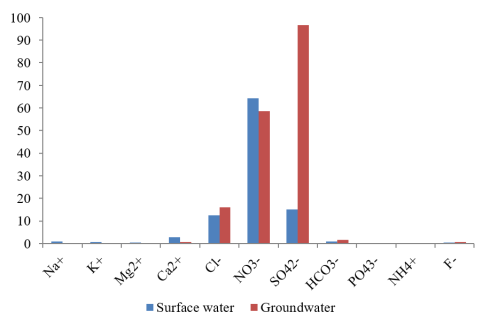
Figure 2. Mean relative concentrations of ions in water of the study area.
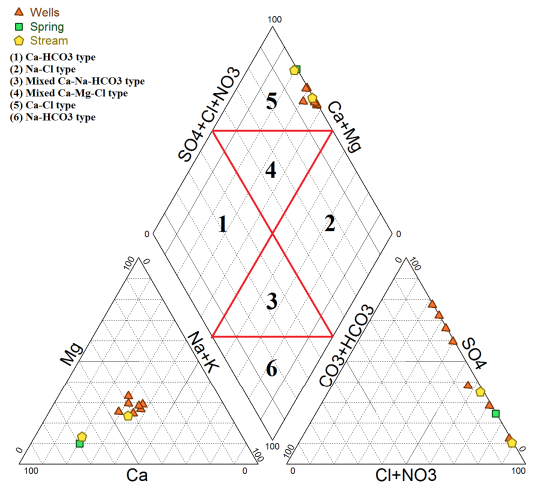
Figure 3. Water facies showing of Mbankomo.
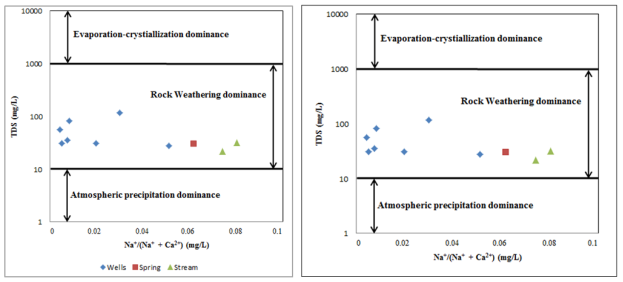
Figure 4. Mechanism governing water chemistry.
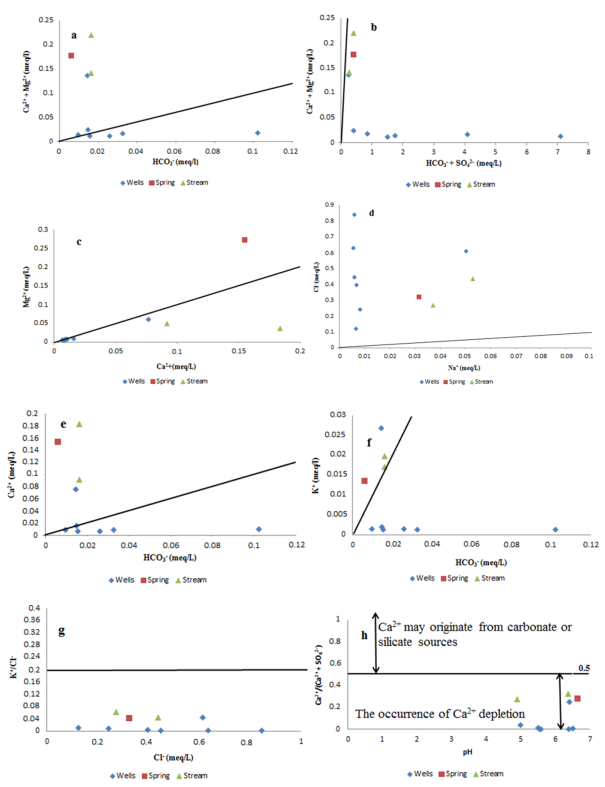
Figure 5. Relationships between major ion concentrations of water samples of study area to discriminate hydrochemical processes. (a) (Ca2++ Mg2+) vs. HCO3-, (b) (Ca2++ Mg2+) vs. HCO3- + SO42-, (c) Mg2+ vs. Ca2+, (d) Cl- vs. Na+, (e) Ca2+ vs. HCO3-, (f) K+ vs. HCO3-, (g) K+/Cl- vs. Cl-, (h) Ca2+/ Ca2++ SO42- vs. pH.
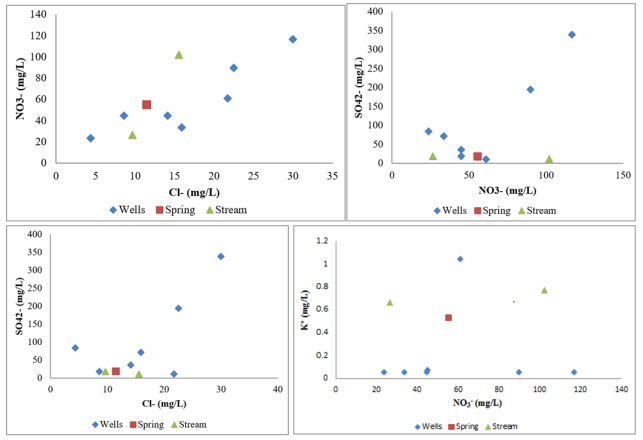
Figure 6.
Relationship between NO3- vs Cl-, SO42- vs NO3-, Cl- vs SO42- and K+ vs SO42-.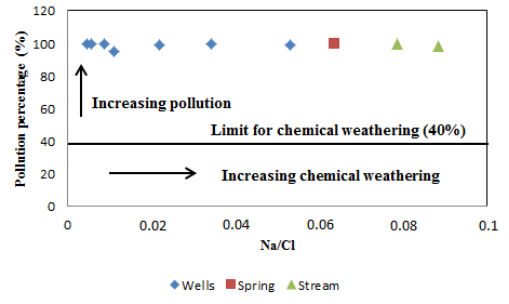
Figure 7. Variation in the percentage of pollution as a function of Na/Cl in water of study area.
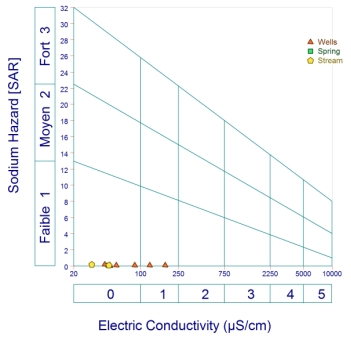
Figure 8. Suitability of water for irrigation from Riverside diagrams.
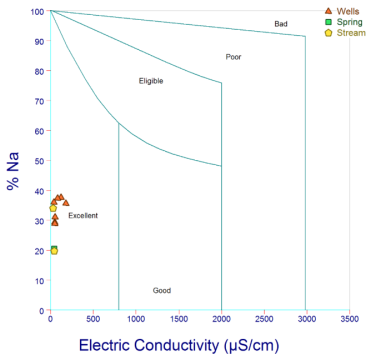
Figure 9. Suitability of water for irrigation from Wilcox diagrams.